
Red Agent Swarms for Testing Customer-Facing AI Agents
LLM applications have a semi-infinite attack surface, and they are notoriously hard to secure without breaking the user experience.
AI
LLM
AI Safety
Flow logs are the native network logging layer for AWS. These logs can be setup specifically for logging IP traffic on subnets, network interfaces, or VPCs. VPC flow logs in particular contain a vast amount of IP traffic information and data points for our resources that can be leveraged for:
In this blog post, we'll be learning how to:
In the following example, a flow log publishes all IP resource traffic in a VPC to a CloudWatch log group:
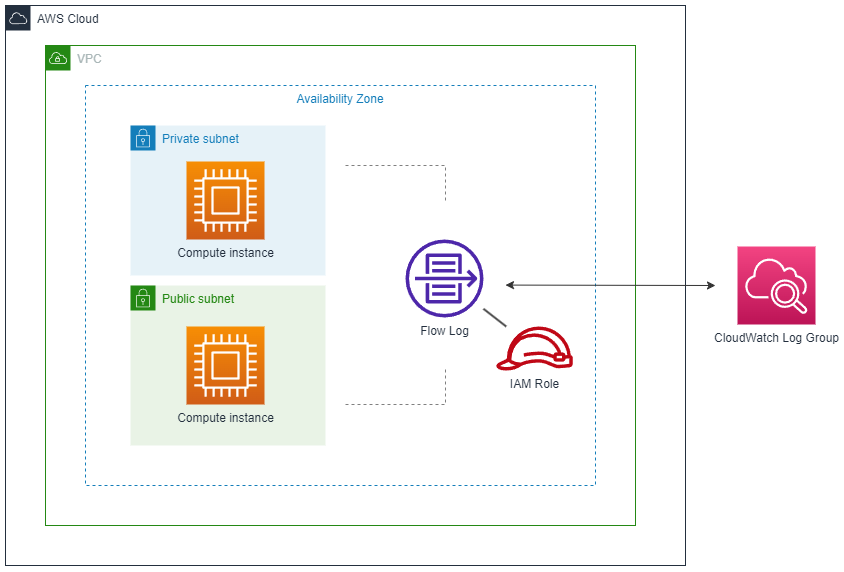
The flow log needs an IAM role with write-access for publishing the logs to CloudWatch.
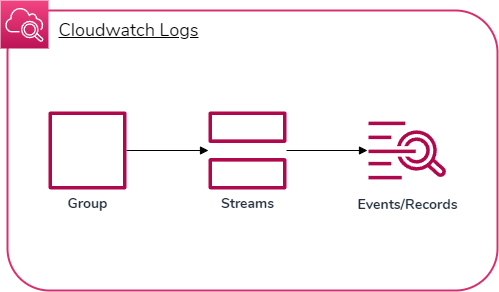
The way VPC flow logs are published to CloudWatch is in three steps:
Basically, a log group consists of log streams which consist of log events.
Now that we have an idea about how flow logs work and how we can find our network data in CloudWatch, let's build some flow logs!
AWS CDK allows us to write cloud application resources through code in a supported language (Typescript, Python, Go, etc.) which then gets provisioned/deployed by AWS CloudFormation in the background. We often use constructs, which are basic cloud components that can be made of one or more resources, in order to build our application.
There are a couple ways we can set up flow logs with AWS CDK for Python:
add_flow_log methodFlowLog construct is a high-level flow log resource we can add to a CDK stack by instantiating itHowever, these options use the default log format and don't allow for setting a custom log format, which is a crucial feature for choosing specific data fields in our network traffic that we want the logs to output.
The solution is to build a custom AWS CDK construct with the lower-level construct CfnFlowLog since it includes a log_format attribute. By building a custom construct based on CfnFlowLog, we can:
Let's look at a custom FlowLog construct that implements this feature.
from aws_cdk import aws_iam as iam, aws_logs as logs, aws_ec2 as ec2
from constructs import Construct


class FlowLog(Construct):
  def __init__(self, scope: Construct, id: str, *args, vpc: ec2.Vpc, **kwargs):
    super().__init__(scope, id, **kwargs)

    self.vpc = vpc

    self.role = iam.Role(
      self,
      "Role",
      assumed_by=iam.ServicePrincipal("vpc-flow-logs.amazonaws.com"),
    )

    self.log_group = logs.LogGroup(
      self, "LogGroup", retention=logs.RetentionDays.TWO_WEEKS
    )

    self.log_group.grant_write(self.role)

    self.flow_log = ec2.CfnFlowLog(
      self,
      "FlowLog",
      resource_id=self.vpc.vpc_id,
      resource_type="VPC",
      traffic_type="ALL",
      deliver_logs_permission_arn=self.role.role_arn,
      log_destination_type="cloud-watch-logs",
      log_group_name=self.log_group.log_group_name,
      log_format="${traffic-path} ${flow-direction} ${region} ${account-id} ${interface-id} ${srcaddr} ${dstaddr} ${srcport} ${dstport} ${action} ${log-status}",
)class FlowLog(Construct):
def __init__(self, scope: Construct, id: str, *args, vpc: ec2.Vpc, **kwargs):
super().__init__(scope, id, **kwargs)
self.vpc = vpc
FlowLog class inherits from Construct that can be reused in multiple stacks for deploymentvpc is required to associate a new or existing VPC in the stack with its own flow logsvpc is identified with self.vpc self.role = iam.Role(
self,
"Role",
assumed_by=iam.ServicePrincipal("vpc-flow-logs.amazonaws.com"),
)
self.log_group = logs.LogGroup(
self, "LogGroup", retention=logs.RetentionDays.TWO_WEEKS
)
self.log_group.grant_write(self.role)This is where the flow log is actually created and connects with all the other components we've setup.
      self.flow_log = ec2.CfnFlowLog(
        self,
        "FlowLog",
        resource_id=self.vpc.vpc_id,
        resource_type="VPC",
        traffic_type="ALL",
        deliver_logs_permission_arn=self.role.role_arn,
        log_destination_type="cloud-watch-logs",
        log_group_name=self.log_group.log_group_name,
        log_format="${traffic-path} ${flow-direction} ${region} ${account-id} ${interface-id} ${srcaddr} ${dstaddr} ${srcport} ${dstport} ${action} ${log-status}",
      )
resource_id – Associates the flow log to a given VPC by IDdeliver_log_permission_arn – Associates the IAM role by ARN (for granting write permission to the CloudWatch log group we created)log_group_name – Identifies the log group to write flow logs tolog_format – Specifies the custom log format that appears on log events. Here is a full list of data fields you can customize the format withA stack is a unit for deployment that is provisioned by AWS CloudFormation and can be added to an app for the stack to be deployed to AWS. You can imagine an app consisting of multiple stacks which consist of multiple resource constructs. We can import the custom flow log construct we just made into a stack to prepare it for deployment.
from aws_cdk import Stack, aws_ec2 as ec2
from flowlog import FlowLog


class MyStack(Stack):
  def __init__(self, scope: Construct, id: str):
    super().__init(scope, id)

    self.vpc = ec2.Vpc(self, "MyVPC")

self.flow_log = FlowLog(self, "MyFlowLog", vpc=self.vpc)FlowLog construct from a local Python file (flowlog.py)There are plenty of data fields we can use for customizing our log format, as listed here. Recognizing the right fields depends on your use case, as some fields may be more useful than others.
Here is a collection of data fields you may find useful for network traffic monitoring and security with sample use cases:
| Field | Summary | Example use cases |
|---|---|---|
account-id | The AWS account ID of the owner of a source network interface. | Identifying AWS users so that only trusted users are accessing specific resources from the VPC. |
interface-id | The ID of the network interface (resource) whose IP traffic is being recorded. | Identifying which resource is being monitored in a flow log record. |
region | The region that contains the network interface for which traffic is recorded. | Evaluating whether region-to-region transfers are being made which generally results in high latency, bogged-down bandwidth, and high costs. |
subnet-id | The ID of the subnet that contains the network interface whose IP traffic is being recorded. | Ensuring resources are running in their proper subnets. |
srcaddr | Source address of incoming traffic or IP address of network interface for outgoing traffic. | Verifying only trusted resources are sending data out or detecting incoming traffic as possible threats or unknown sources. |
dstaddr | Destination address of outgoing traffic or IP address of network interface for incoming traffic. | Ensuring resources are only accessing verified destination addresses, or only trusted resources are being accessed. |
srcport | Source port of traffic. | Ensuring that only trusted applications on a local resource are being used for accessing external resources, or vice versa. |
dstport | Destination port of traffic. | Ensuring that only trusted applications on an external resource are accessing local resources, or vice versa. |
flow-direction | Whether the traffic flow is ingress (incoming) or egress (outgoing). | Identifying only outgoing traffic by specifying egress within a CloudWatch Log Insights query. |
traffic-path | A specific numerical value representing the path that egress traffic takes to its destination. | Verifying resources are using intended paths to their destination, such as a VPC gateway endpoint instead of a NAT gateway to lower S3/DynamoDB access costs. |
action | Whether the traffic is accepted (ACCEPT) or rejected (REJECT). | Diagnosing traffic that may not be allowed by security groups or network ACLs, or packets arrived after a connection was closed. |
log-status | Whether data logged normally (OK), no network traffic to/from the network interface (NODATA), or some flow log records were skipped (SKIPDATA). | Ensuring traffic logging is successful, detecting if resources are unable to transfer data with each other. |
An example of a log event using the data fields above as a custom log format is:
107530157253 eni-0c103a04bdb4e905c us-east-1 subnet-0cbf1673fe2 11.4.2.2 5.21.62.92 4213 80 egress 8 ACCEPT OKCloudWatch Log Insights can be used to query CloudWatch log events with SQL-like syntax. VPC flow logs can aggregate CloudWatch log events very quickly, so querying can be very useful for specifying a log group's log events that we are interested in viewing based on their data points.
For example, let's say we want to see recent outgoing traffic from a specific user's resources. Let's look for the 20 most recent log events where the user's account ID is 107530157253 and the traffic is outgoing or egress. We can run the following query:
fields @timestamp, @message, accountId as ID, flowDirection
| sort @timestamp desc
| filter (
    ID = '107530157253' and
    flowDirection = "egress"
    )
| limit 20
fields specifies the values that are imported from a log event, where @message is the log dataaccountId is a given value from the log event referenced in the query as IDflowDirection specifies whether traffic is incoming (ingress) or outgoing (egress)filter gets log events that match one or more conditionsEnabling VPC flow logs that publish to CloudWatch logs has a multitude of benefits with the various data fields provided. Being able to directly monitor resources in a VPC and query data through flow logs can be a valuable addition to your networking toolset.
Read more about the latest and greatest work Rearc has been up to.
LLM applications have a semi-infinite attack surface, and they are notoriously hard to secure without breaking the user experience.

Recently, articles surrounding the supposed dangers of an open source abliteration tool called Heretic, along with legal notice being served to its creator, have inspired me to speak out for two reasons.
A step-by-step guide to deploying a Databricks workspace with Private Service Connect (PSC) on GCP and common pitfalls to avoid.

A deep dive into Databricks Foreign Catalogs for Glue Iceberg table access
Tell us more about your custom needs.
We’ll get back to you, really fast
We will evaluate your query and respond within 2 business days.
Kick-off meeting
We will schedule a quick meeting to further understand your use case and start working toward a solution together!