
Red Agent Swarms for Testing Customer-Facing AI Agents
LLM applications have a semi-infinite attack surface, and they are notoriously hard to secure without breaking the user experience.
AI
LLM
AI Safety

AI applications are springing up like bamboo these days. It's easy to get started, with tools like LangChain and Databricks and virtually every other cloud platform offering a battery of new AI offerings. However, building these AI systems introduces new challenges that aren't all present in traditional software development. Additionally, these AI systems are frequently distributed systems too, which are also more complicated to develop and maintain (in some ways) than normal monolithic applications.
In this post, we'll discuss this growing genre of applications, and how the recent release of MLFlow Tracing can restore some sanity to the development process. We'll start with a high-level discussion of what makes these systems different, and then build an example chatbot to demonstrate both these problems and how MLFlow Tracing can help solve them.
Sometimes, in the domain of AI, we speak of "AI" as referring only to a core model. This model is an atomic unit, perhaps a combination between a Pytorch codebase and a file of weights used by that code. This core model is the heart of the AI, without which nothing else would exist.
However, in practice, this heart is often not useful on its own. Features need computing, text needs chunking, samples need batching, and the whole thing needs a useful API. In most cases, the core model is just one component of a much larger system.
Prior to deep learning, this distinction was often insignificant. Models were cheap to duplicate and straightforward to run. In the modern era, however, especially when faced with Large Language Models, we simply cannot ignore the complexity and cost of deploying a model. As such, it has become far more common to implement distributed AI systems, e.g. where one set of servers runs the LLM model, another handles batching, and some other handles wrapping that LLM interface in a more application-specific API.
This shift has also been accelerated by the use of generalized AI components. For example, not only are there millions of users of ChatGPT, but ChatGPT is only one of thousands of applications powered by GPT-4. GPT-4 itself is exposed through an API (yet another layer of abstraction around the core model) which is then used by other applications, for example code completion services. These services are then usable downstream by direct users or, perhaps other automated systems. At the heart of these myriad users and use cases is a single core model that must be scaled and managed with care, since the demand on its outputs threatens to exceed the compute capacity available on the planet.
This combination of building AI systems that tend towards being distributed and re-using generalized components in multiple ways has led to the growth of a type of software referred to as "compound AI systems". That is, we are building more and more systems that each present themselves as "AI" that are actually combinations of components of which only some are, in a traditional sense, "AI".
Consider, for example, Github Copilot Workspace, a toolset that uses AI to build out software in response to requirements, issues, and comments from the developer. The AI agent writes code and tests it, submits pull requests, and plans out its work on larger-scale tasks. So, which part is the AI? The LLM that writes the code? The agent that uses one LLM to generate the project plan and then schedules another LLM to execute that plan? Or the bot that listens for issues and comments and uses an LLM to decide how to comply with the developer's request? The answer is that the whole thing is a "compound AI system", a complete system that provides AI-dependent functionality through the combination of machine learning components and traditional software.
This is a powerful trend and describes the rise of much of the AI service ecosystem in the past several years; however, if you have attempted to implement such a system (or any other highly distributed system, for that matter), you'll know that building and maintaining such a system quickly becomes a nightmare. In traditional distributed systems, "tracing" and toolkits like OpenTelemetry have helped bring some sanity back into the world. However, in the AI domain specifically, we're often interested not only in inter-system communications, but also intra-system coordination. Additionally, substantial portions of the software are likely to be written with off-the-shelf libraries which, themselves, may have intricate internal connections and which includes code that we can't easily modify or introspect. Errors also arise not merely as crashes or HTTP codes, but also as subtle undermining of complex AI models or merely unintended outputs for which no deterministic prevention exists.
In the remainder of this article, we're going to show by example how to manage this complexity by using MLFlow's new Tracing feature to gain painless, scalable visibility into our compound AI system without applying significant additional burden on our developers.
To both illustrate the issue clearly and demonstrate the practical advantages of tracing, let's walk through an example using Databricks, which also provides convenient access to the features we need for our application.
We're going to build a super-simple RAG chatbot to answer technical questions, primarily (but not exclusively) about Databricks. Here are the technologies we'll use to put this together in just a few minutes:
Let's start by putting together our knowledge base. For the sake of simplicity, we'll use an in-memory database, but there are plenty of easy-to-use options you should consider instead in a real use case.
First, we'll install the required dependencies:
# Install external dependencies for this demo
%pip install opentelemetry-api opentelemetry-sdk langchain -q

%pip install \
    transformers==4.30.2 \
    langchain==0.1.8 \
    langchain-community \
    langchain-chroma \
    langchainhub \
    databricks-sdk==0.20.0

# Uninstall existing mlflow to avoid installation issues
%pip uninstall mlflow mlflow-skinny -y

# Install the MLflow trace prototype .whl
#May Refresh (Traces saved in MLflow UI, Query Traces, Tracing in Model Serving)
%pip install "https://ml-team-public-read.s3.us-west-2.amazonaws.com/mlflow-tracing/wheels/mlflow-2.12.1-20240430-py3-none-any.whl" -U
%pip install "https://ml-team-public-read.s3.us-west-2.amazonaws.com/mlflow-tracing/wheels/mlflow_skinny-2.12.1-20240430-py3-none-any.whl" -U

dbutils.library.restartPython()
Next, we'll add a bit of relevant documentation to use:
from langchain_core.documents import Document

docs = [
    Document(page_content="Delta files use a combination of parquet files for raw storage and custom manifests for transaction management.", metadata=dict(docs="databricks")),
    Document(page_content="Databases are built on Delta Lake and are stored as Delta files on underlying storage, such as S3", metadata=dict(docs="databricks")),
    Document(page_content="Because databases are just files, you pay by usage on that underlying platform. You only pay for compute you run on top of that.", metadata=dict(docs="databricks")),
    Document(page_content="Serverless SQL Warehouses allow you to rapidly spin up clusters for short durations, so you are only billed for a few seconds per query when not under steady load.", metadata=dict(docs="databricks")),
    Document(page_content="Database instances are billed by hour, and must be running to receive and respond to queries. Consider using t4g.micro instances for prototyping.", metadata=dict(docs="aws")),
]

docs = dict(enumerate(docs))
Now we can set up a Chroma DB with our docs:
from langchain_community.embeddings import DatabricksEmbeddings
from langchain_chroma import Chroma

embedding_function = DatabricksEmbeddings(endpoint="databricks-bge-large-en")
db = Chroma.from_documents(docs, embedding_function, ids=[str(i) for i in range(len(docs))])

# Convert the database connection into a langchain "retriever"
retriever = db.as_retriever(search_kwargs={"k": 2})
And check that it's working:
retriever.invoke("How does Databricks store databases?")Result:
[
  Document(page_content='Databases are built on Delta Lake and are stored as Delta files on underlying storage, such as S3', metadata={'docs': 'databricks'}),
  Document(page_content='Because databases are just files, you pay by usage on that underlying platform. You only pay for compute you run on top of that.', metadata={'docs': 'databricks'})
]
And then we pull in the LLM:
from langchain_community.chat_models import ChatDatabricks

chat_model = ChatDatabricks(
    target_uri="databricks",
    endpoint="databricks-dbrx-instruct",
    temperature=0.1,
)
Again, we check it:
from langchain_core.messages import HumanMessage
chat_model.invoke([HumanMessage(content="hello")]).content
Result:
"Hello! How can I assist you today? I'm here to help with any questions or tasks you have. Just let me know what you need."Great! We have our knowledge base with real information, and we have a live connection to our LLM. Now we combine the pieces. Again, we'll use off-the-shelf components for simplicity, but you could build this from scratch without much difficulty if you wanted:
from langchain.chains import RetrievalQA
from langchain import hub

# Use pre-built RAG prompt
prompt = hub.pull("rlm/rag-prompt")

# Use pre-built RAG chain
rag_chain = RetrievalQA.from_chain_type(
    chat_model,
    retriever=retriever,
    chain_type_kwargs={"prompt": prompt}
)
And we check it:
rag_chain.invoke(input="How does Databricks store databases?")Result:
{'query': 'How does Databricks store databases?',
 'result': 'Databricks stores databases as Delta files on underlying storage platforms like S3. This means that you pay for storage based on your usage of the underlying platform, and for compute resources only when you run processes on top of the data.'}
Obviously, in a production context, we'd test this a lot more, but this suffices for demonstration.
So great, we've built and tested our bot, and then we deploy it for real use. Then one day, we get a user complaining that they're getting a junk answer. Here's what they get:
{'query': 'How much does it cost to run a database?',
 'result': 'The cost to run a database depends on the platform and instance type you choose. Generally, you pay by usage, which includes the compute resources required to run and respond to queries. For prototyping, you might consider using t4g.micro instances, which are typically billed by the hour.'}
The user then looked into it, but there was nothing on the databricks documentation about t4g.micro or anything similar.
In fact, this has nothing to do with Databricks, and the answer is quite misleading in this context.
Whether or not you recognize t4g.micro from AWS instance sizes, the real question is: why did the LLM think this was a good response to this particular question?
We built our bot to answer Databricks questions, not AWS questions.
There are a few possibilities:
t4g.micro from a bad database query that yielded misleading resultst4g.micro from a good database query that yielded unexpected dataThe real challenge, however, is that each of these possibilities is somewhat tricky to test. The LLM, and thus the chain, is non-deterministic, so there's no guarantee you'll get the same answer if you ask the same question. In this particular case, we'll be able to replicate the odd answer, but in a real production case, it's entirely possible that you could suffer from a significant bad-response rate and not be able to reliably replicate any of those responses in a controlled environment. Additionally, if we review the code we wrote, there's no obvious place to put logging statements or work with a debugger. The code we wrote is all merely combining components; the code that's running is almost 100% pre-written in external modules.
Enter MLFlow Tracing.
There are a variety of ways to add tracing with MLFlow, but one of the most convenient options is auto-logging, which will hook transparently into LangChain.
import mlflow

mlflow.langchain.autolog()
The docs show a variety of other ways to integrate tracing into your code if desired, but this functionality is particularly useful for adding tracing to external components.
With that code run, all we need to do is try running our code again:
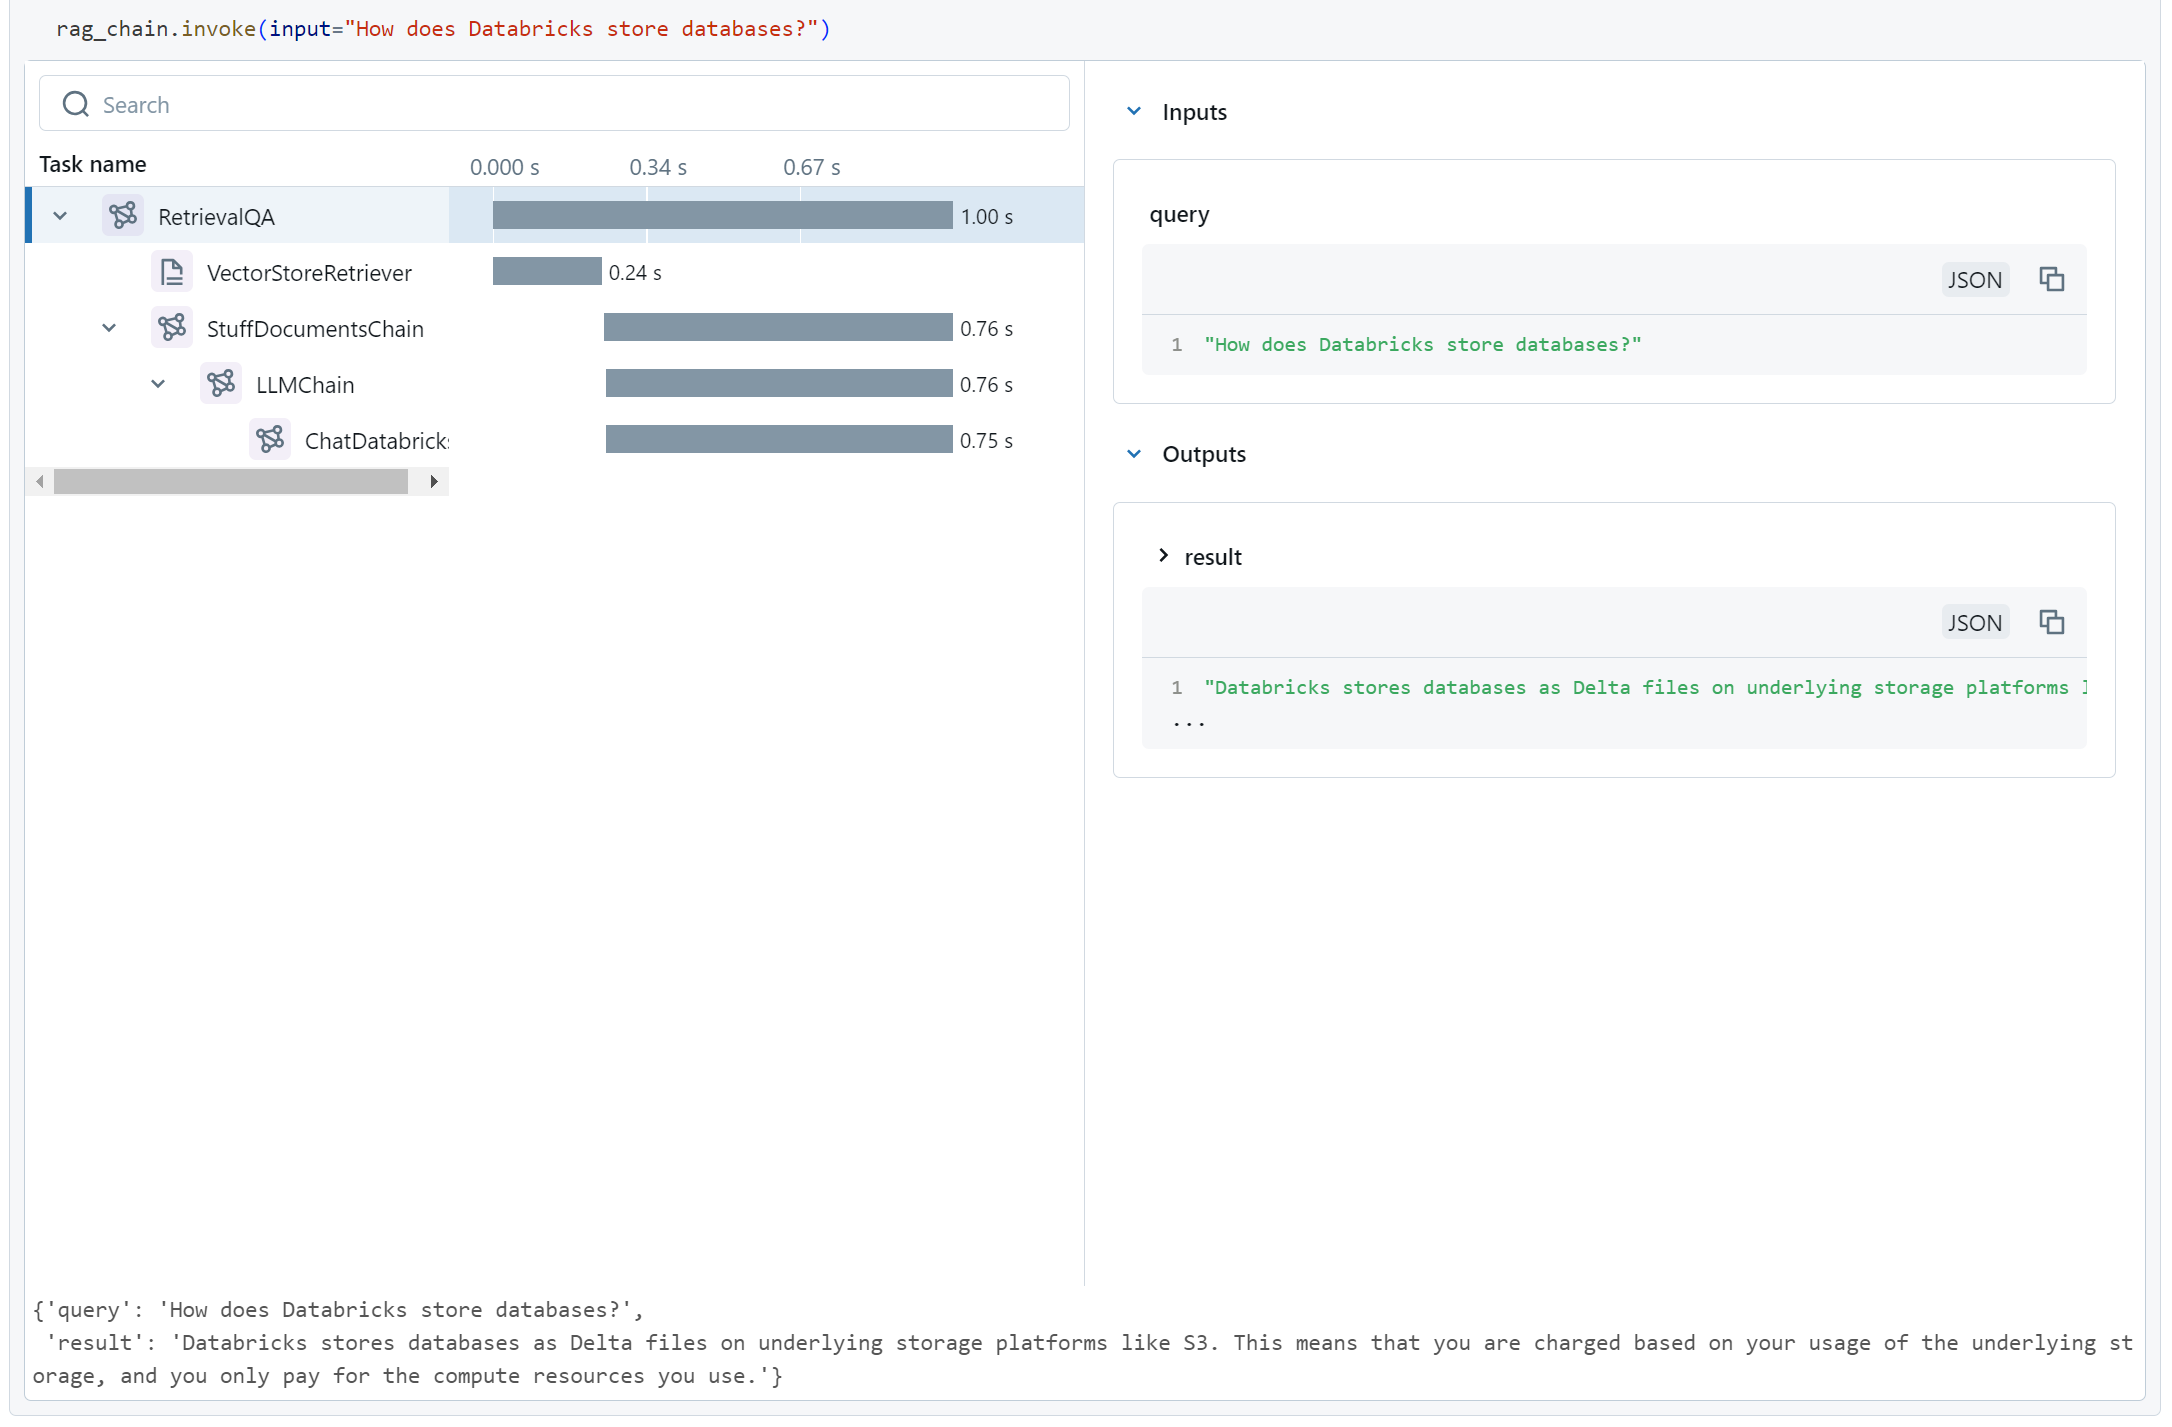
rag_chain.invoke(input="How much does it cost to run a database?")When we run this, MLFlow Tracing tracks how all the components of our chain invoke each other, and what their inputs and outputs are. It stores this data in a resilient location, but also conveniently displays it right away for us.
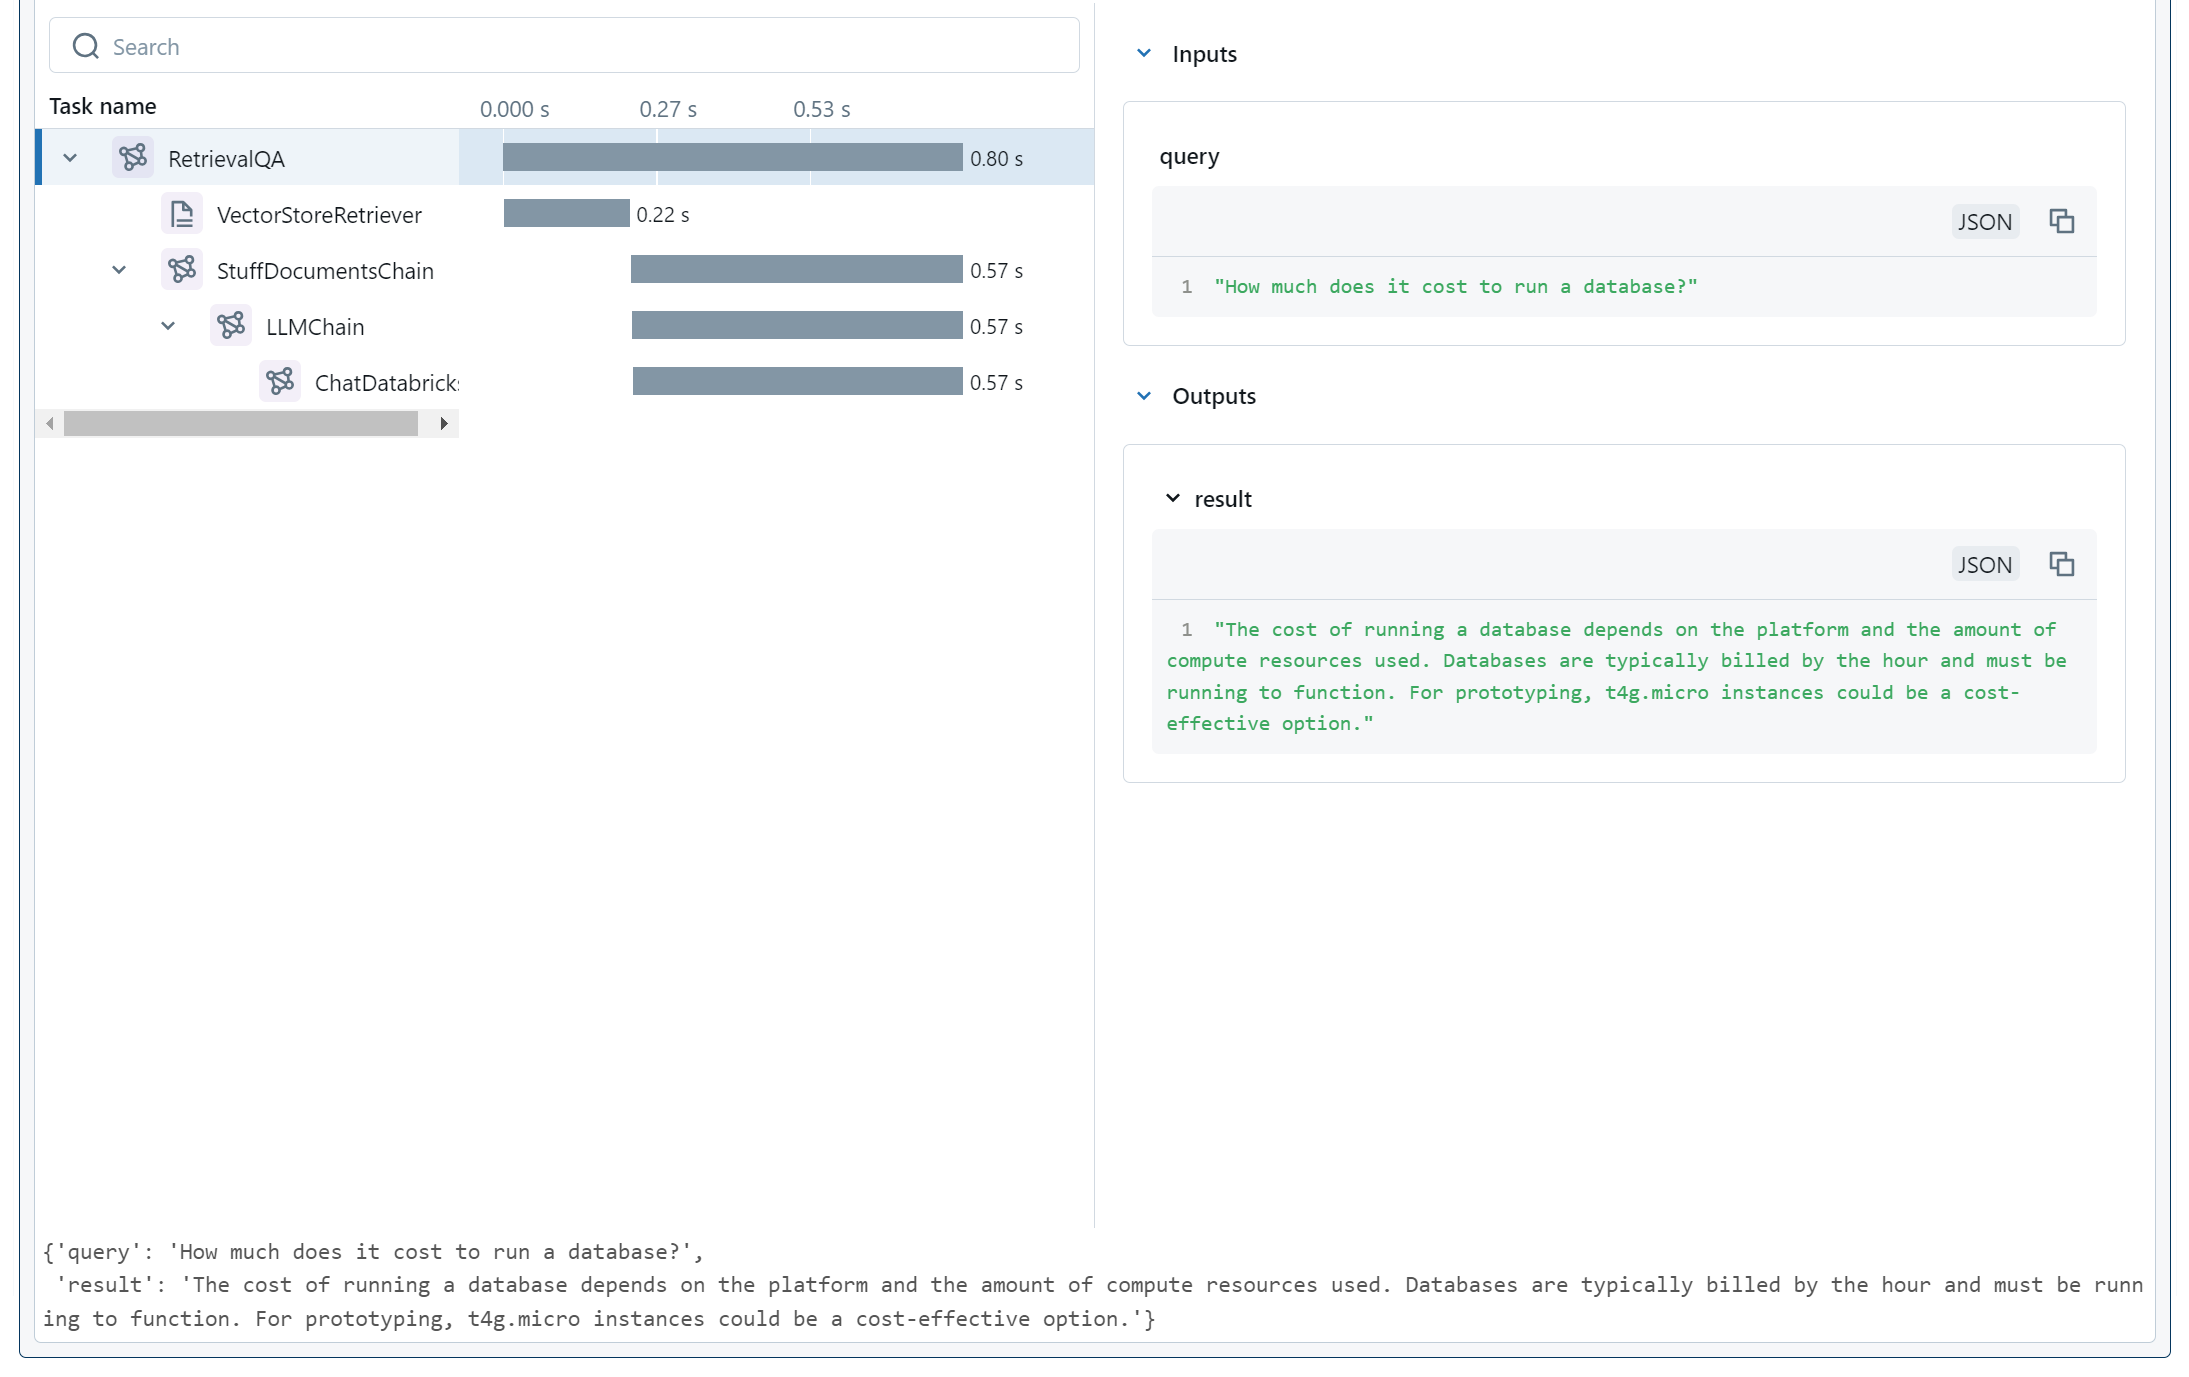
In this widget, we can see the whole chain traced out. We see the various components, their timings, and (since we have the top-level item selected) the top-level inputs and outputs.
Fortunately, we did replicate the weird output that we wanted, so now we can look around in our trace widget to see what happened inside the model. If we select the retrieval stage, we'll see the following:
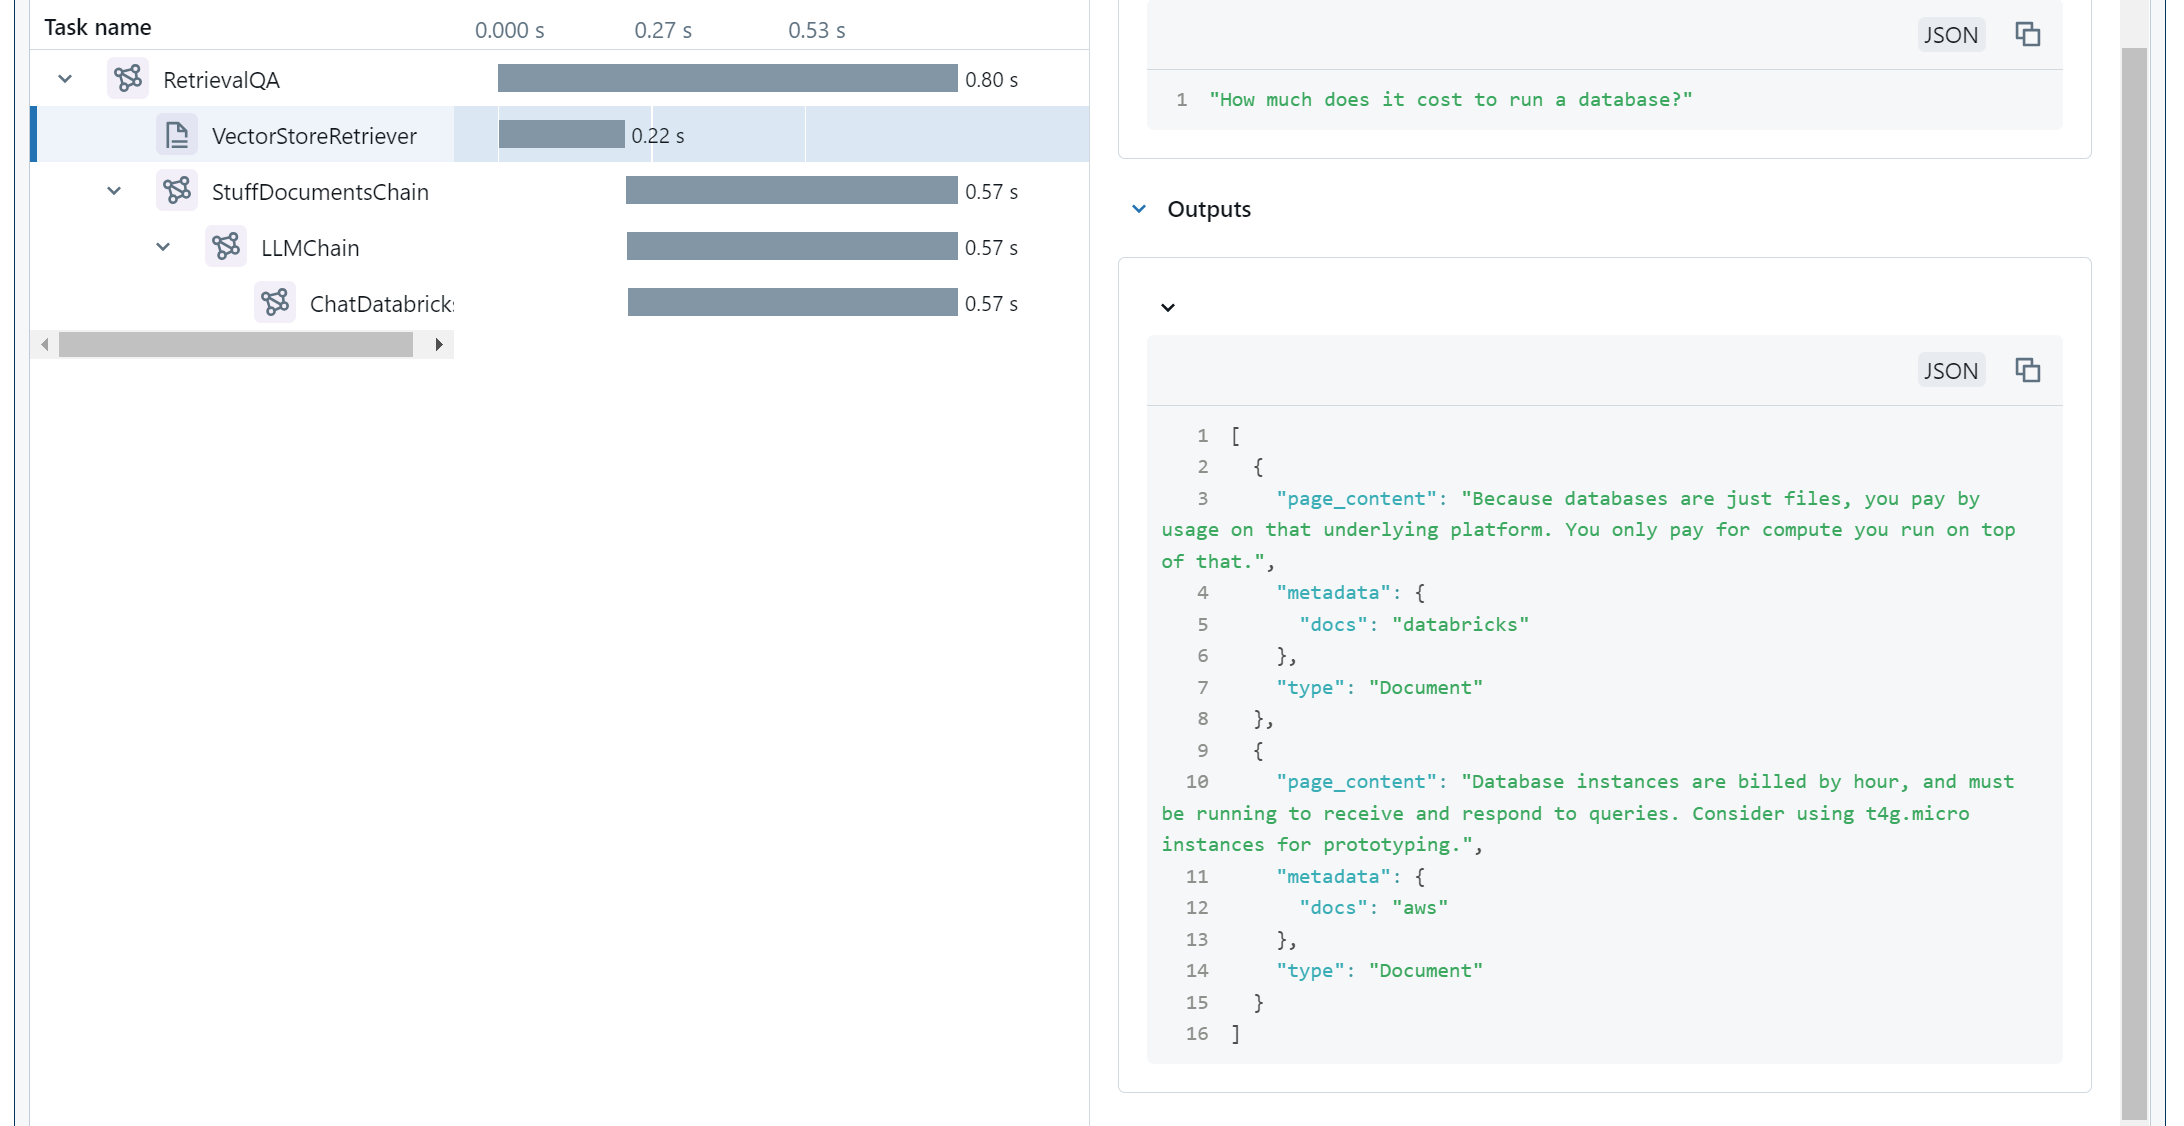
A little bit of critical reading later, we notice that t4g.micro gets mentioned in some other documentation, tagged as belonging to AWS rather than Databricks.
This kind of issue may arise from a variety of circumstances:
Whatever the cause of the bad data, we now know why our application did what it did. Now we just have to choose how to fix it.
In this case, let's fix it by filtering our retrieval to only Databricks documents:
retriever = db.as_retriever(search_kwargs={"k": 2, "filter": {"docs": "databricks"}})And check it:
retriever.invoke("How much does it cost to run a database?")Note that:
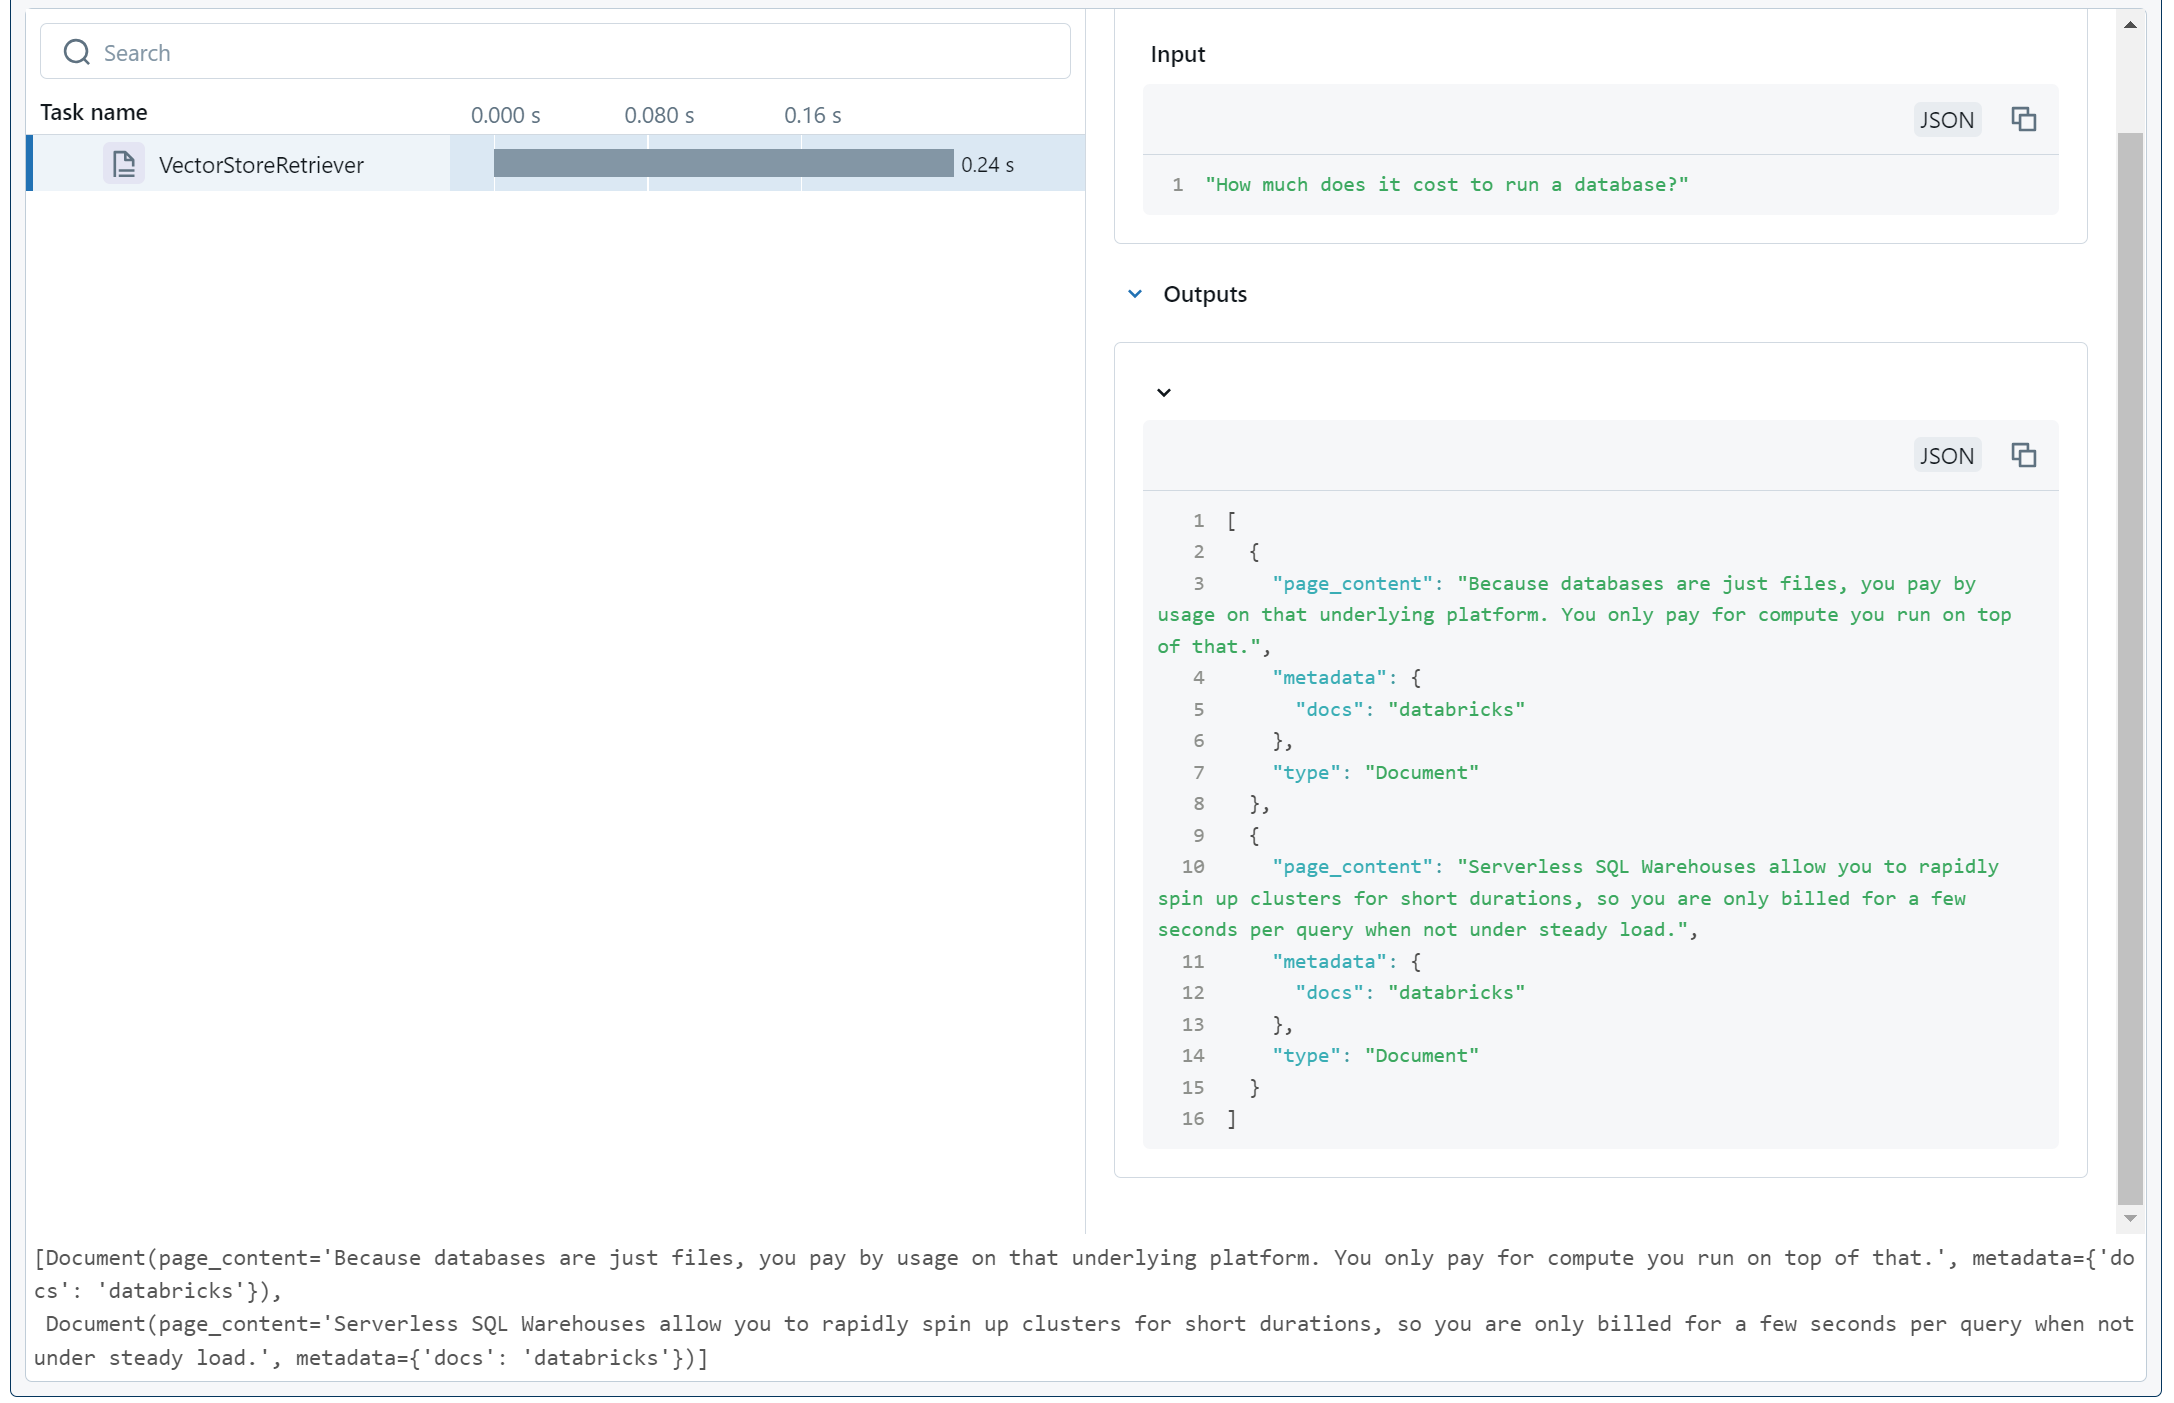
The retriever is deterministic, so this test proves to us that we're no longer fetching AWS documentation in this chatbot.
Finally, we put all the components together again:
# Use pre-built RAG prompt
prompt = hub.pull("rlm/rag-prompt")

# Use pre-built RAG chain
rag_chain = RetrievalQA.from_chain_type(
    chat_model,
    retriever=retriever,  # <- The updated retriever
    chain_type_kwargs={"prompt": prompt}
)
And check it on the previously broken question:
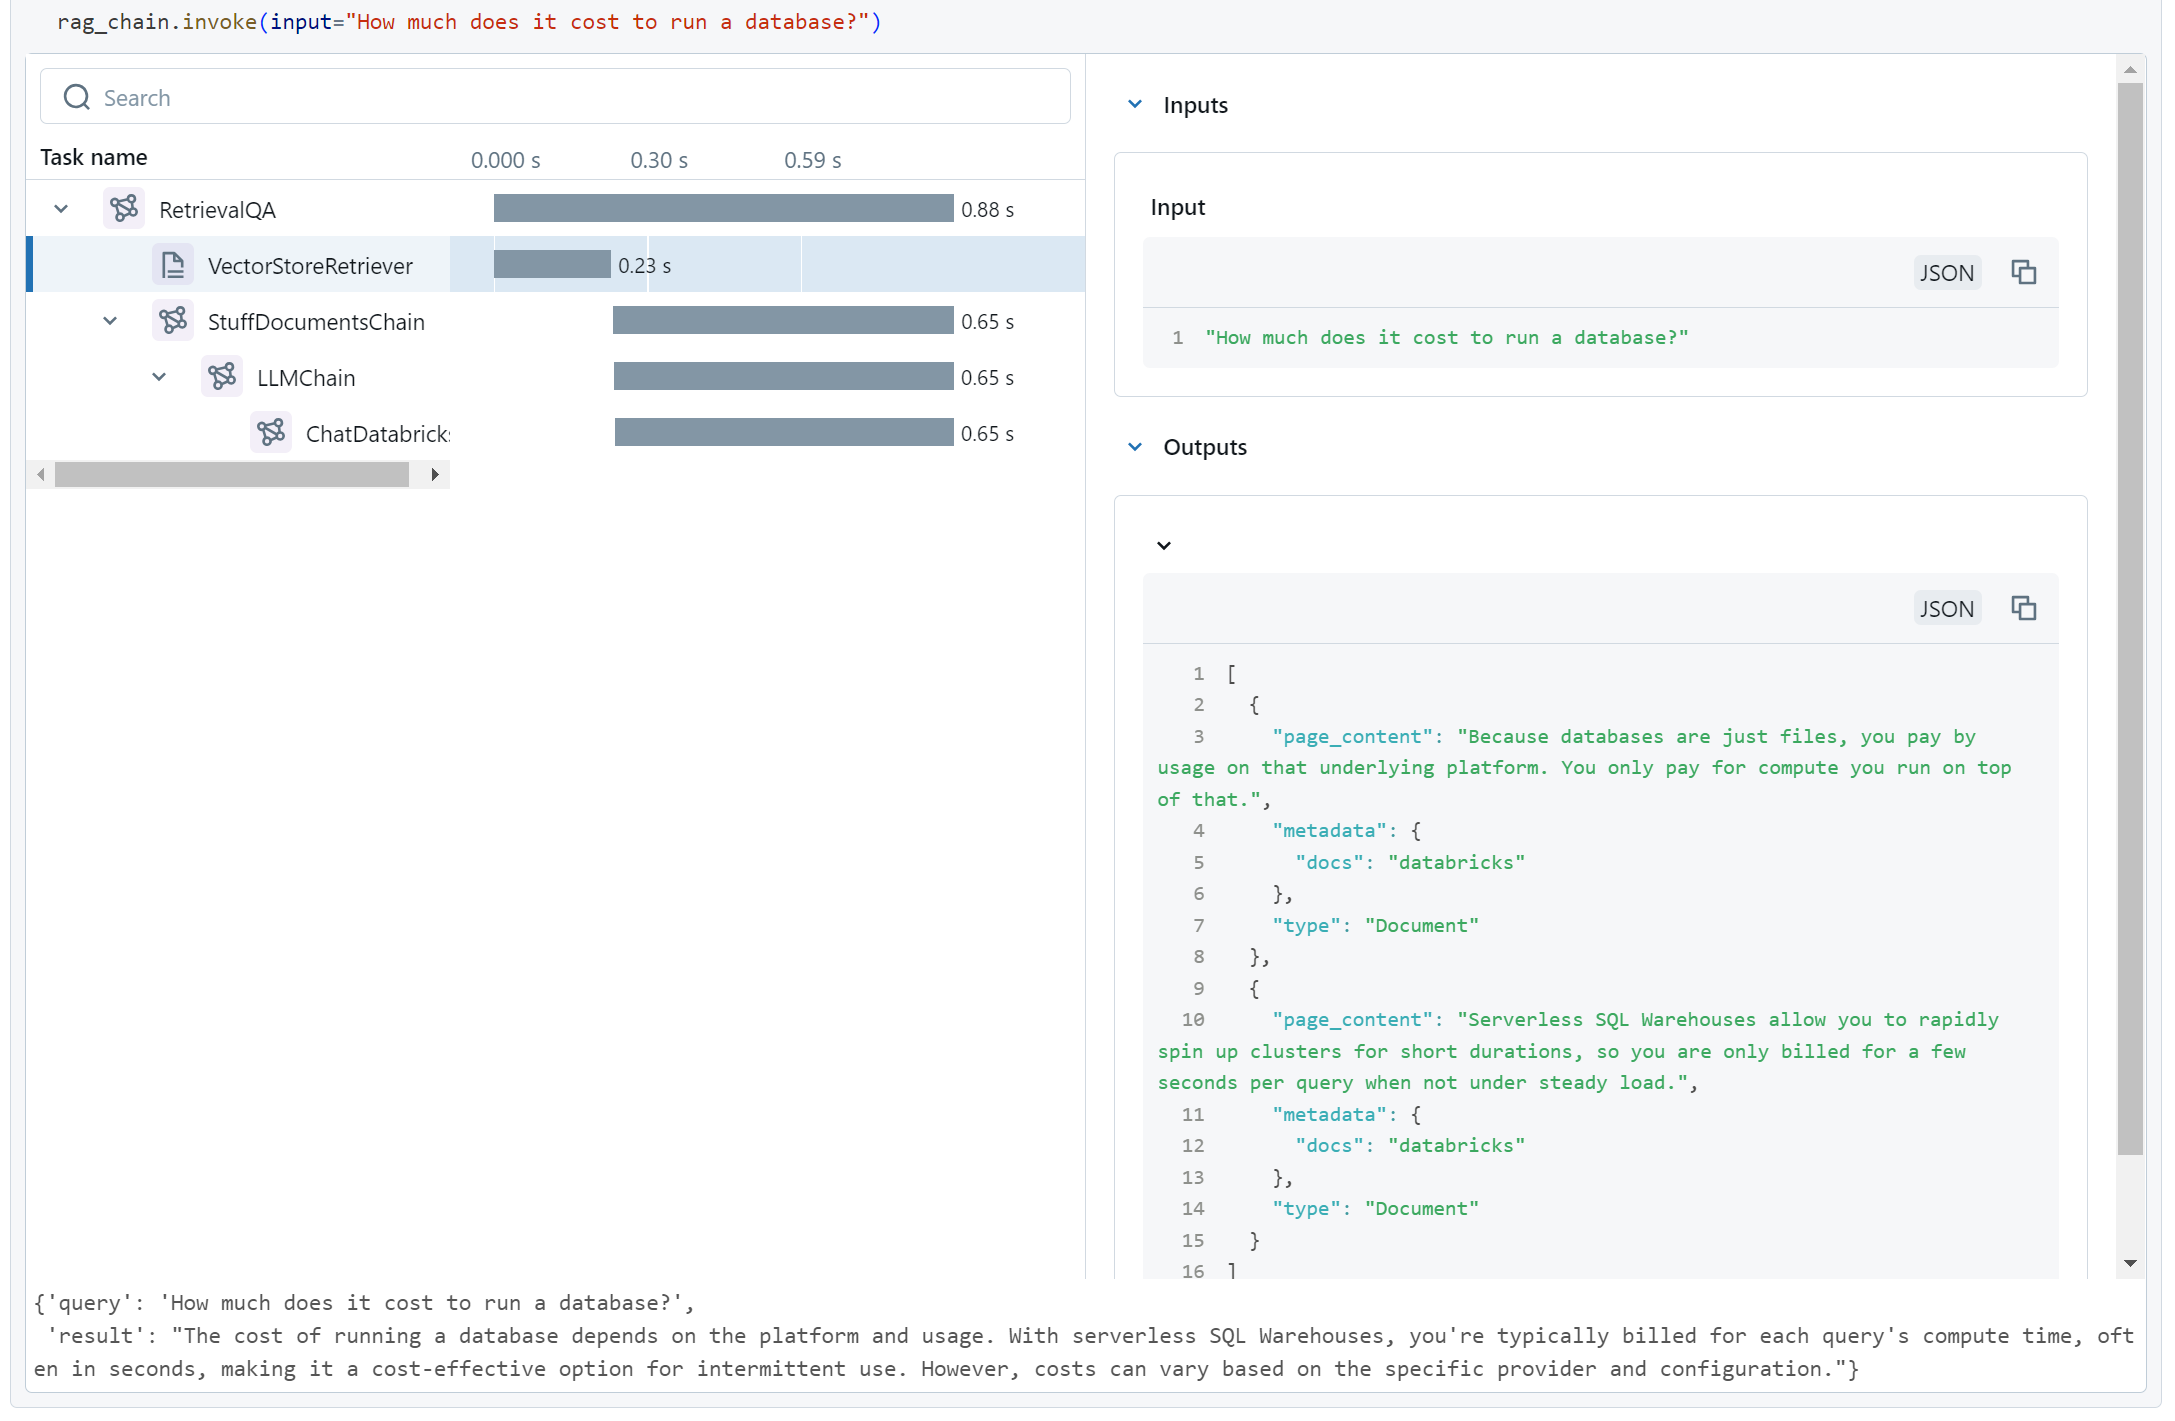
Yup, that looks good.
Let's also check the question that worked originally to make sure we didn't break anything:
Also looks good.
How does this fix the repeatability issue?
MLFlow Tracing isn't just printing a pretty widget in our notebook. It's also sending OpenTelemetry traces to a metric server (in this case, one hosted by Databricks) so we can always dig these results up later. That means we can store traces not merely during development and debugging, but also in production. The next time a user gets a wonky output, we won't merely have records of their interaction, we'll also have the model's internal tracking of why it generated those erroneous outputs.
To see these traces in the Databricks console, we go to the "Experiments" dashboard:
We then select the application we were running (in the above case, an experiment is auto-created for the notebook I was working in) and go to the "Traces" tab:
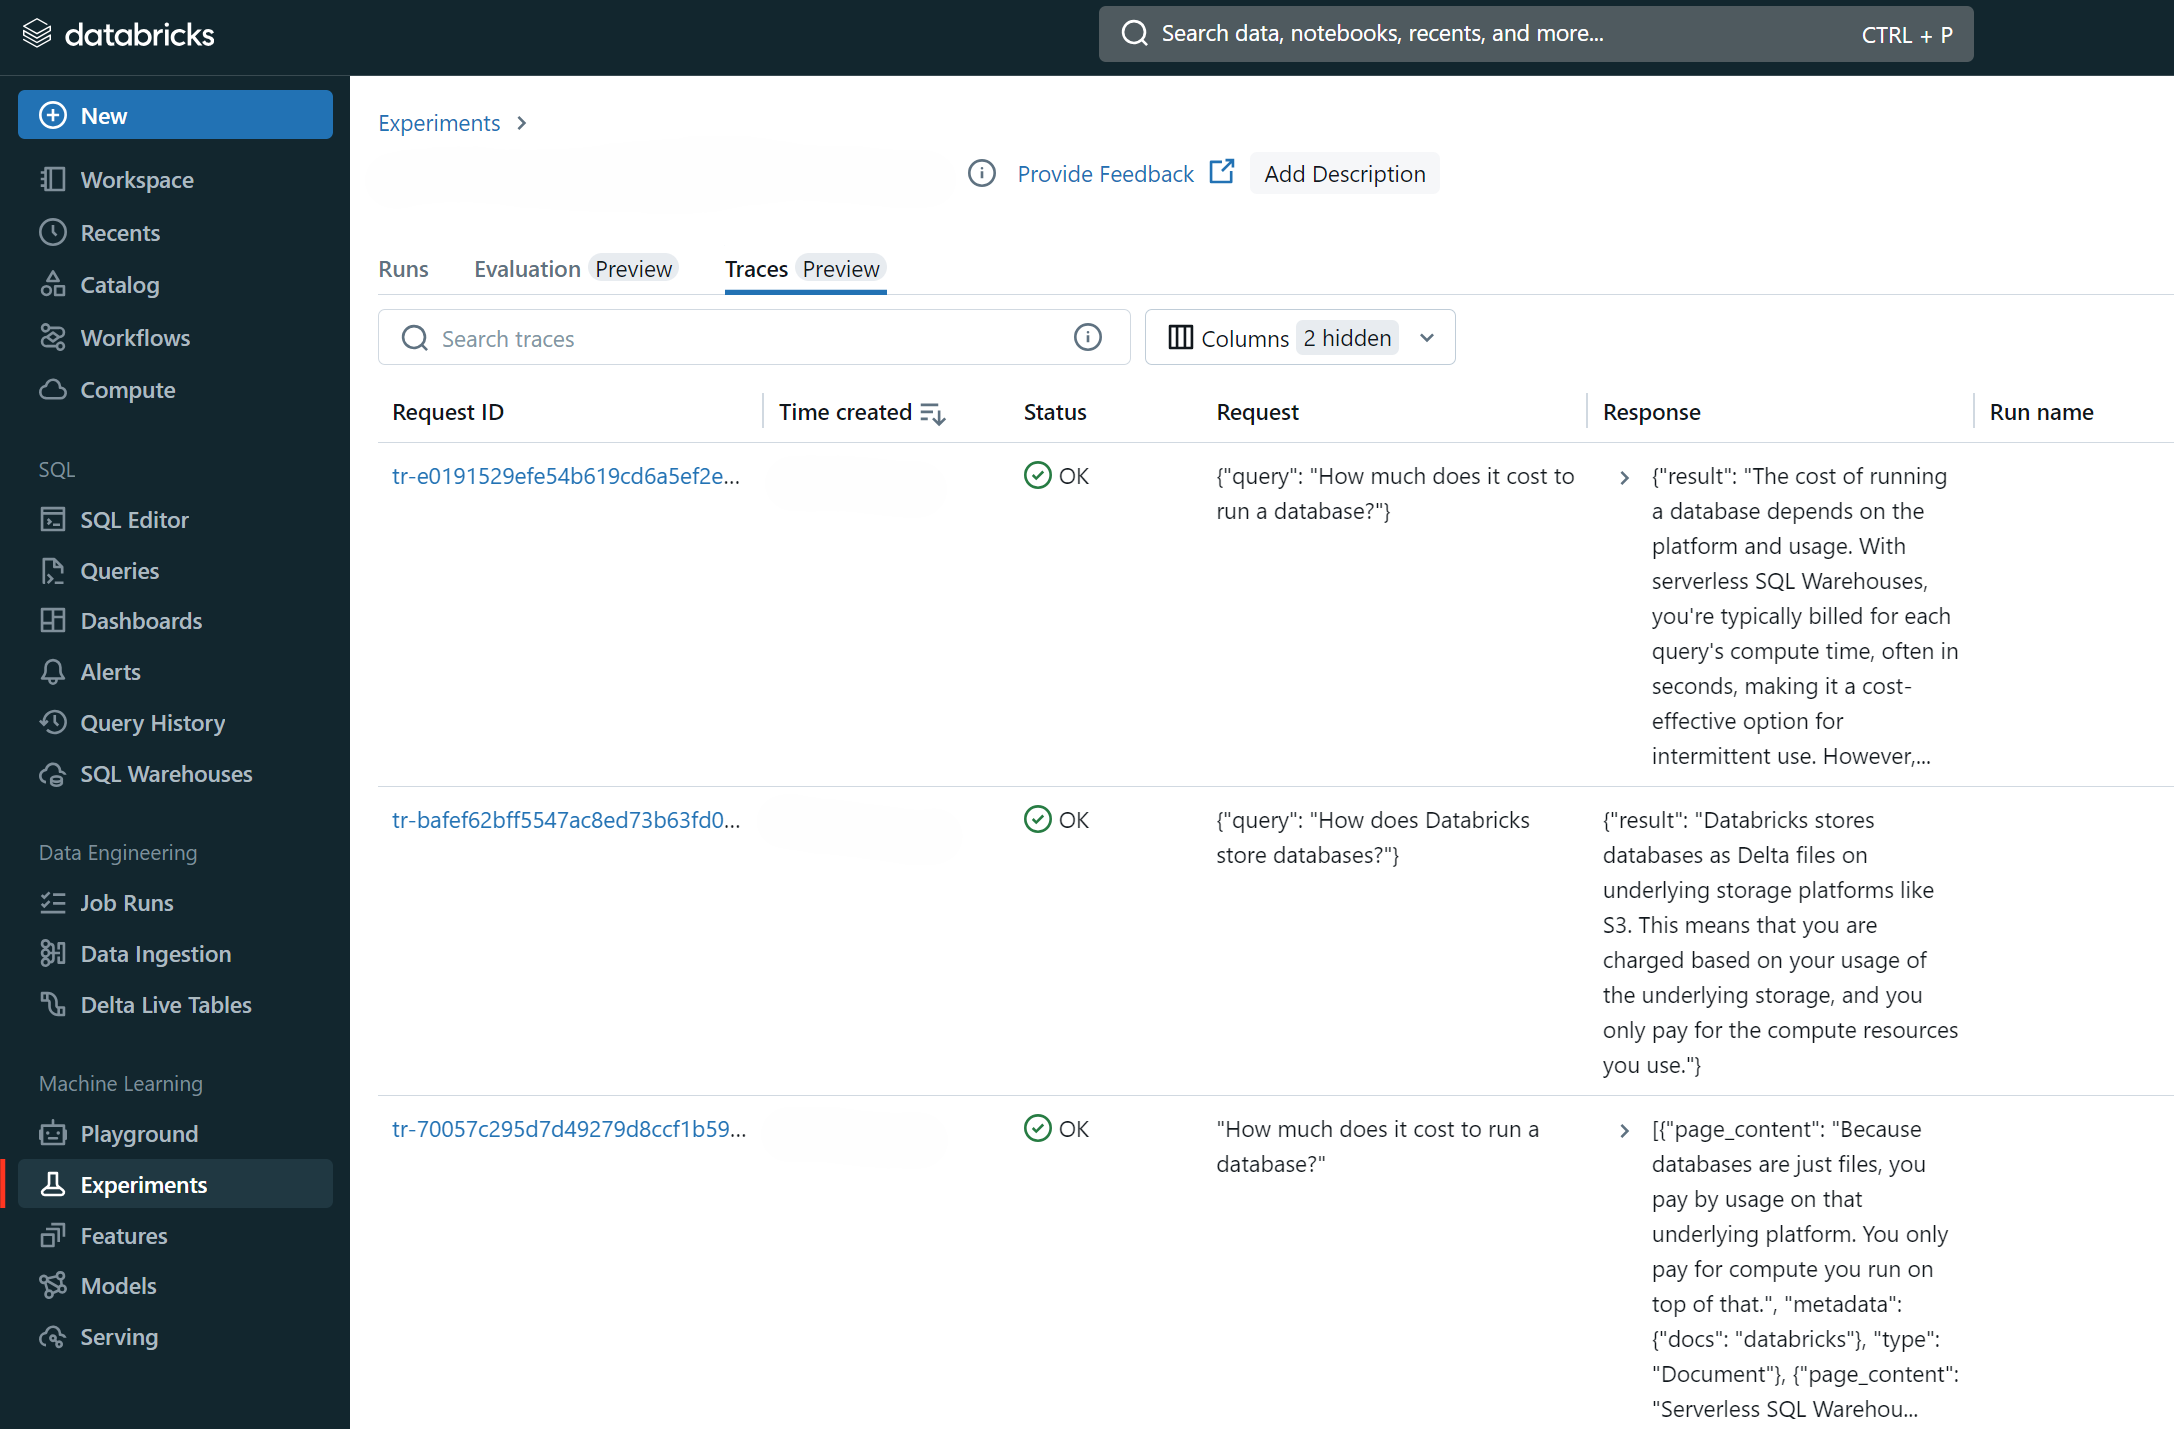
Here we can see and search all our traces, and investigate one-off issues whether or not we can reproduce them.
In this article, we discussed how the rise of compound AI systems has complicated the software development and maintenance process. We then showed an example of how even simple code may produce unexpected results for non-obvious reasons. Finally, we introduced MLFlow Tracing by applying it to our example and showing how it made debugging easy and improved our confidence in our solution.
There are many features of MLFlow Tracing, and obviously far more of MLFlow in general, that we don't discuss here for the sake of brevity. The overall point is that as the process of application development gets more complicated, it becomes increasingly important to use good tooling proactively to ensure that, when issues do come up, you're poised to be able to handle them in a timely and reliable fashion. MLFlow is one such suite of tools, and its tight integration with Databricks allow it to deliver a high-quality developer experience out-of-the-box.
Rearc provides services to satisfy bespoke LLM, AI, and MLOps requirements in complicated enterprise contexts like financial services and healthcare. We specialize in the Databricks and AWS ecosystems, bringing a strong Cloud and DevOps background so you can trust that your solutions are scalable and maintainable. If you have any enterprise AI requirements you need help with, just reach out to us at ai@rearc.io for consultation.
Read more about the latest and greatest work Rearc has been up to.
LLM applications have a semi-infinite attack surface, and they are notoriously hard to secure without breaking the user experience.

Recently, articles surrounding the supposed dangers of an open source abliteration tool called Heretic, along with legal notice being served to its creator, have inspired me to speak out for two reasons.
A step-by-step guide to deploying a Databricks workspace with Private Service Connect (PSC) on GCP and common pitfalls to avoid.

A deep dive into Databricks Foreign Catalogs for Glue Iceberg table access
Tell us more about your custom needs.
We’ll get back to you, really fast
We will evaluate your query and respond within 2 business days.
Kick-off meeting
We will schedule a quick meeting to further understand your use case and start working toward a solution together!